I was discussing it the other day with Giannis:
How can we measure the return on investment (ROI) on a digital technology solution like ours?
This problem has already been highlighted by others. I recently read a very interesting GFSI blog post by Stephanie Burchardt about the ROI on Testo’s digital food safety management system. This blog post reports that the ROI measured in the case of a European grocery chain with 750 stores has been impressive: the estimated annual savings made by implementing Testo‘s digital system were over €5,000 per store and almost 3.8MEuros for the whole chain.
So, how do we measure ROI on our food safety intelligence software? This is a crucial question, as our solution is not the cheapest in the market. It is rather one of the quite expensive ones, as it aims to serve large quality and safety teams that are responsible for complex, global supply chains with thousands of suppliers or hundreds of manufacturing sites.
You might be wondering:
Am I really saying that by we could not calculate how much money our clients would save by investing in our technology?
The honest answer is yes, up to last week we couldn’t.

(Photo by Austin Distel on Unsplash)
To be more specific, it has been difficult for us to identify the critical tasks we help make more efficient and then to find an appropriate way to measure how much these cost to a very large food manufacturer or retailer. We lacked the simple and practical method in which we could estimate how much time of their teams went into tasks such as:
- horizon scanning for relevant food safety incidents
- gathering and processing data of importance that comes in various formats
- analyzing data to identify important trends or issues
- putting together findings into reports that should be shared with others in the organization
Therefore, we could not say with confidence whether we are the right solution for a candidate client, or whether they would be better off with one of the other solutions in the market. Which meant that we could not quantify the value that someone will get from investing in our solution.
So, we started brainstorming about it.
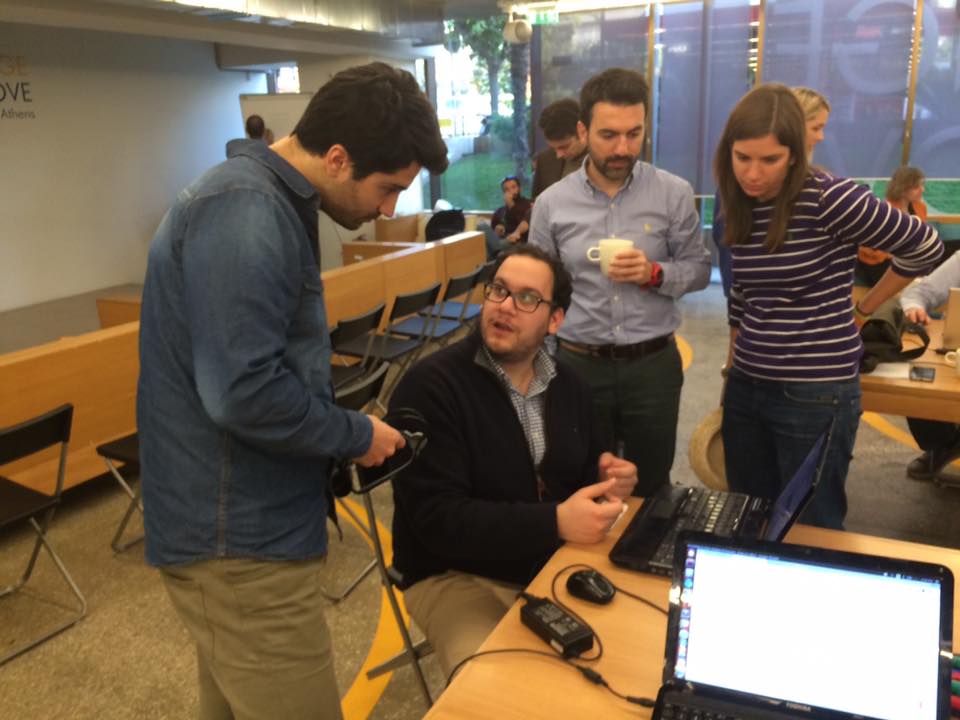
The first important thing was to find the critical questions that a safety and quality director should be able to answer.
We know that the event that is having the greatest impact in a large manufacturer or retailer, is the recall of a product. Either an internal one that has to be managed effectively before the product reaches the consumers. Or an external one, which means that the recall can also create a large damage to the brand.
The questions to ask are therefore the following:
- How many people are working on a full time basis to prevent internal and external product recalls in the central quality and safety team?
- Which percentage (%) of their time goes to the tasks listed before? That is, tasks such as horizon scanning, data processing, data analysis, and report generation. To assess and estimate the risks associated with specific suppliers or ingredients. As part of your team’s ongoing safety monitoring and assessment tasks.
This can give us an estimate of the time that a team currently devotes to such tasks that our enterprise food safety software solution supports.
Then, the million dollar question comes: what is the average annual cost of your FSQA team? Because this input will help calculate how much data seeking, analysis and reporting activities actually cost to this team.

(Photo by Masarath Alkhaili on Unsplash)
Here is an example:
The central FSQA team in a company has 5 members. Half an hour every morning (or 5% of their time) goes into horizon scanning activities, to make sure that nothing wrong has come up since last night. Processing, combining and analyzing such data in a spreadsheet takes about 1 hour every day (or 15% more of their time).
Every week, about half a day goes into using the data in the spreadsheet to assess the risk associated with the suppliers of the company; and half a day to assess the risk of ingredients. This is almost 20% more of the time of the team.
Even more important: all these data or specific insights about upcoming trends or newly spotted issues need to be shared with others in the company. This requires the creation of a document or PPT reporting the findings. Let us assume that it takes a full day every week (i.e. 20% of their time).
Overall, this adds up to almost 60% of the time of these people roughly going to such data-intensive activities.
What would you consider to be a reasonable ROI on a software solution that can help save some of this time?

Photo by Volkan Olmez on Unsplash
Let’s see what the million dollar question has to say.
Assuming that the average annual cost of each member in the FSQA team of our example is around $80,000, the current investment that is going into such tasks is estimated to be near to $240,000 every year. Our food safety intelligence solution promises to save over 50% of this time. This means saving almost $120,000 every year.
To calculate the ROI on FOODAKAI, one should deduct from this amount the investment that needs to be made on the software itself (its annual subscription), as well as the cost of any extra time that the FSQA team should devote to become familiar with the system.
How much ROI would this result to?
Giannis had a brilliant idea: let’s create an online ROI calculator for this. In this way, everyone visiting our web site can enter their data and calculate how much savings such an investment can help make. So, that’s what is coming next.

